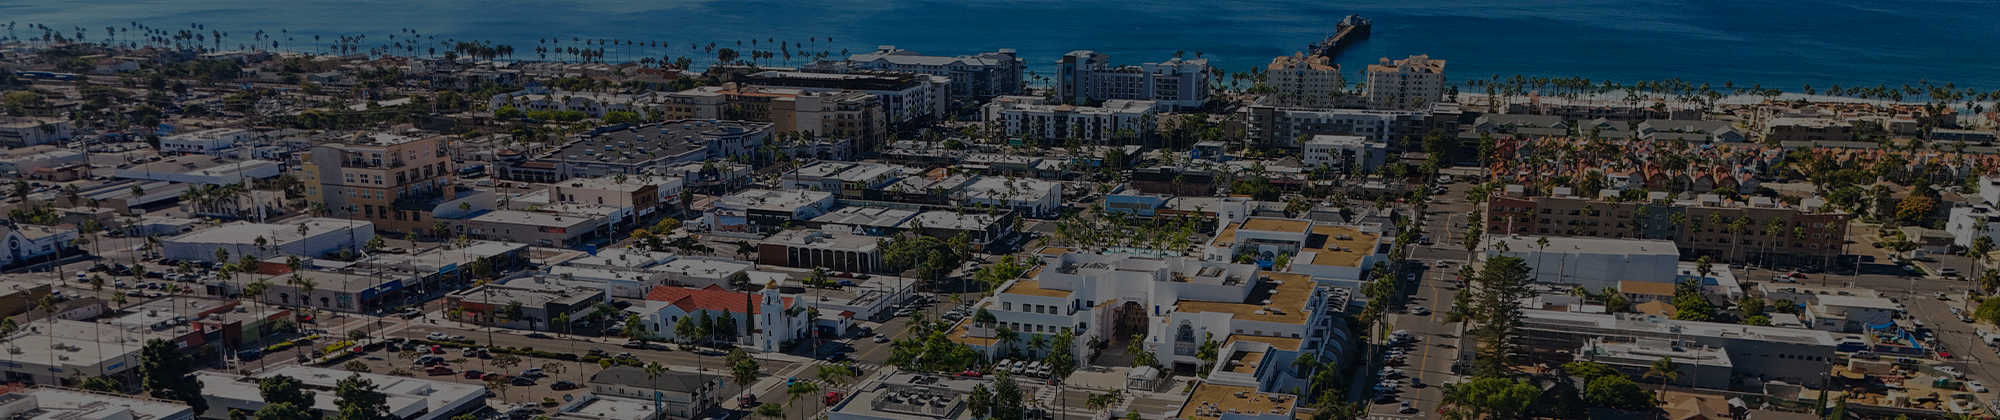
More than 902,300 miles are driven through the city of Oceanside every day, according to data from the California Office of Traffic Safety (OTS). That’s a lot of traffic for this coastal city, which is home to about 172,000 people. Between residents, tourists, and people who travel to Oceanside to work, the city’s roads are often jam-packed with traffic.
Where there’s traffic, motor vehicle accidents tend to follow; Oceanside is no exception. In fact, statistically speaking, the city averages between one and two collisions every day.
Contact our Oceanside car accident lawyers from Petrov Personal Injury Lawyers, at (619) 344-0360 to schedule a free initial consultation.
Oceanside Car Accident Statistics – 2021 Update
According to UC Berkeley’s Transportation Injury Mapping System (TIMS), 706 car accidents were reported in Oceanside, California, in 2021.
In total, 982 people were injured or killed in these collisions:
- 595 people complained of injuries
- 312 people sustained visible trauma
- 48 people were severely injured, and
- 16 people were killed
Based on these car accident statistics, there was a car accident in Oceanside every 1.93 days in 2021.
What Types of Car Accidents Usually Happen in Oceanside?
While no two collisions are ever identical, there are different types of accidents that can happen.
In Oceanside, rear-end collisions are the most common, accounting for 34 percent of all auto accidents in 2021.
One out of every four accidents in Oceanside is a broadside collision, while 11 percent involve a vehicle striking a fixed object.
Other common types of car accidents in Oceanside include:
- Sideswipes (8.36 percent)
- Head-on collisions (6.8 percent)
- Rollovers (5.95 percent)
- And vehicle-pedestrian accidents (5.52 percent).
About 4 percent of all accidents in Oceanside fall into some other category.
Oceanside Car Accident Statistical Trends
Oceanside has actually seen a decline in auto accidents in recent years. In fact, traffic accidents dropped by about 14 percent between 2018 and 2019. Accidents dropped again between 2019 and 2020.
However, since then, accidents have been on the rise – with 2021’s numbers rivaling those reported back in 2018.
- 2018: 724 (8 fatal)
- 2019: 625 accidents (5 fatal)
- 2020: 571 (13 fatal)
- 2021: 706 (16 fatal)
While the overall number of accidents may have declined, fatal accidents have surged in recent years. Since 2018, fatal crashes in Oceanside have doubled.
- 2018: 8 fatal accidents
- 2019: 5 fatal accidents
- 2020: 13 fatal accidents
- 2021: 16 fatal accidents
Note that crash data for 2021 is preliminary and subject to change. As the state continues to see an increase in traffic in the post-pandemic era, traffic accidents are likely to rise.
Breaking Down the Leading Causes of Car Accidents in Oceanside
Negligence – or the failure to use reasonable care – is the primary cause of auto accidents in Oceanside, California. In fact, out of the 706 reported collisions in 2021, 8 out of 10 involved some type of motorist negligence.
Does Speeding Contribute to Many Car Accidents in Oceanside?
Speed was the leading cause of car accidents in Oceanside, CA, in 2021. That year, it was a factor in 244 collisions, accounting for 34.81 percent of all accidents.
Statistically speaking, speed contributes to about one out of every three traffic accidents in Oceanside.
How Many Drunk Driving Accidents Are There in Oceanside?
In 2021, 78 car accidents were caused by drivers or bicyclists who were under the influence of drugs or alcohol. For every 10 car accidents reported in Oceanside, one involved a drunk driver.
What Are the Other Common Causes of Car Accidents in Oceanside?
Crash statistics for 2021 reveal that other common causes of Oceanside wrecks include:
- Improper turning (13.98 percent)
- Failing to yield the right of way (11.27 percent)
- Ignoring traffic signals and signs (6.28 percent)
- Tailgating (3.71 percent)
- Unsafe lane changes (3.71 percent)
- Driving on the wrong side of the road (1.57 percent)
Anytime another driver is negligent, you may reserve the right to file a claim against their insurance coverage and/or pursue compensation from them through a car accident lawsuit.
Are There Many Hit-and-Run Car Accidents in Oceanside?
According to the California Office of Traffic Safety, 55 hit-and-run car accidents were reported in Oceanside, CA, in 2020. As a result, Oceanside ranked 30th among 61 similarly sized cities for hit-and-run collisions.
TIMS data reveals that there were 94 hit-and-run car accidents reported in Oceanside just one year later in 2021.
When Do Most Oceanside Car Accidents Happen?
Believe it or not, Tuesdays between 3 PM and 6 PM were the most dangerous times to drive during 2021. That year, 29 accidents happened during this time – the most of any block of time throughout the year.
Generally speaking, evening rush hour during the week is when many Oceanside car accidents happen. In fact, 30 percent of the city’s car accidents happened between the hours of 3 PM and 9 PM during the workweek.
Car accidents also tended to happen on Saturdays between 12 PM and 9 PM and on Sundays between the hours of 12 PM and 3 PM and 5 PM and 9 PM.
Who’s Involved in Auto Accidents in Oceanside?
Drivers and passengers in their vehicles aren’t the only ones who are involved in and affected by auto accidents in Oceanside. Every year, hundreds of other road users are hurt and killed in car accidents, too.
Bicyclists
In 2021, 56 bicycle accidents were reported in Oceanside, CA. At least 54 bicyclists were injured in these collisions, while two cyclists were killed.
Leading causes of car-and-bike accidents included speeding, improper turning, failing to yield the right of way, and driving/riding on the wrong side of the road.
Bicycle accidents typically happen during the middle of the day – often on Thursdays, Saturdays, and Sundays between the hours of 12 PM and 3 PM.
Based on the TIMS crash data, notably dangerous intersections for bicyclists in Oceanside include:
- Clementine St & Mission Ave
- Coast Hwy & Eaton St
- Mission Ave & Nevada St
- Oceanside Blvd & Vine St
- 8th St & Coast Hwy
- Alley & Cassidy St
- Alvarado St & Cassidy St, and
- Ave de la Plata & College Blvd
This includes bicycle accidents reported within 500 feet of these intersections.
Pedestrians
A total of 36 Oceanside car accidents involved pedestrians in 2021. At least 38 people were injured or killed in these collisions. No fewer than four Oceanside pedestrian accidents were fatal that year.
According to crash data, pedestrians were most likely to be struck by vehicles on Thursdays. For every four pedestrian accidents reported in Oceanside, one happened on a Thursday.
Most pedestrian-and-car accidents happened between the hours of 6 PM and midnight – accounting for 63.8 percent of all collisions.
Interestingly, pedestrian violations contributed to one out of every three reported accidents in 2021.
Coast Hwy was the most dangerous road for pedestrians in 2021, with at least recorded 19 pedestrian accidents.
Motorcyclists
Crash data reveals a total of 82 motorcycle accidents in Oceanside, California, in 2021.
These accidents caused:
- 26 possible injuries
- 54 suspected minor injuries, and
- 10 suspected serious injuries
No lives were lost in fatal motorcycle accidents in Oceanside that year.
Statistically speaking, Thursdays are the most dangerous day for motorcyclists in Oceanside. In 2021, nearly one out of every five motorcycle accidents took place on a Thursday – with the vast majority happening between 12 PM and 9 PM.
Speeding, improper turns, improper yielding, and drugs or alcohol were the primary causes of these motorcycle collisions.
TIMS data reveals that Coast Hwy was a hot spot for motorcycle crashes in 2021, with at least 23 reported collisions that year. Oceanside Blvd, I-5, and SR 76 were also home to a significant number of motorcycle accidents in 2021.
Where Do Most Car Accidents in Oceanside Take Place?
While car accidents can – and do – happen just about anywhere in Oceanside, there are a few intersections that see more collisions than others.
Crash statistics reveal the most dangerous Oceanside intersections for 2021:
- College Blvd & SR 76 (9 accidents)
- College Blvd & Oceanside Blvd (8 accidents)
- CR S11 & El Camino Real & Oceanside Blvd (8 accidents)
- CR S11 & El Camino Real (7 accidents)
- CR S11 & El Camino Real & Mission Ave (6 accidents)
Five intersections tied for the fifth-highest number of auto accidents, with five collisions a piece:
- Civic Center Dr & Coast Hwy
- Guajome Lake Rd & Mission Ave
- Melrose Dr & Oceanside Blvd
- Oceanside Blvd & Vine St
- Oceanside Blvd & Rancho Del Oro Dr
These statistics include any accidents reported within 250 feet of the noted intersections.
Call the Petrov Personal Injury Lawyers For Help After a Car Accident in Oceanside, CA
Car accidents aren’t uncommon in and around Oceanside, California. If you’ve been in an accident or have lost a family member in a fatal Oceanside crash, don’t hesitate to reach out to the Petrov Personal Injury Lawyers for help.
We’re award-winning Oceanside car accident lawyers with 20+ years of experience helping deserving clients just like you. Since 2012, we’ve dedicated our careers to getting justice for our clients by holding negligent motorists and powerful insurance companies accountable.
Call our law office in Oceanside, California, to learn more. We offer a free consultation, so contact our compassionate team to schedule yours today.